Chart Patterns Cheat Sheet
Master the most powerful chart patterns in trading — from classic reversals like Head & Shoulders to high-probability continuations like Flags and Pennants. This cheat sheet breaks down each pattern’s structure, psychology, entry trigger, and how best to use them.
While no pattern works 100% of the time, they become far more effective when used with trend filters, volume confirmation, and other indicators. I prefer bullish setups — especially Inverted Head & Shoulders, Double Bottoms, and the Bullish Falling Wedge — as there is more upside with long trades.
How to add patterns to your TradingView chart:
- 1. Open tradingview.com and select your desired asset.
- 2. Click on the Indicators icon at the top.
- 3. Search for: Head and Shoulders, Double Top, or any other pattern
- 4. Click to add, and adjust settings as needed.
5. Scroll through the chart history to see the patterns on the chart. Review at least 30 and see how many times they hit the target and how many times they fail, and decide which ones you ant to master.
Reversal Patterns
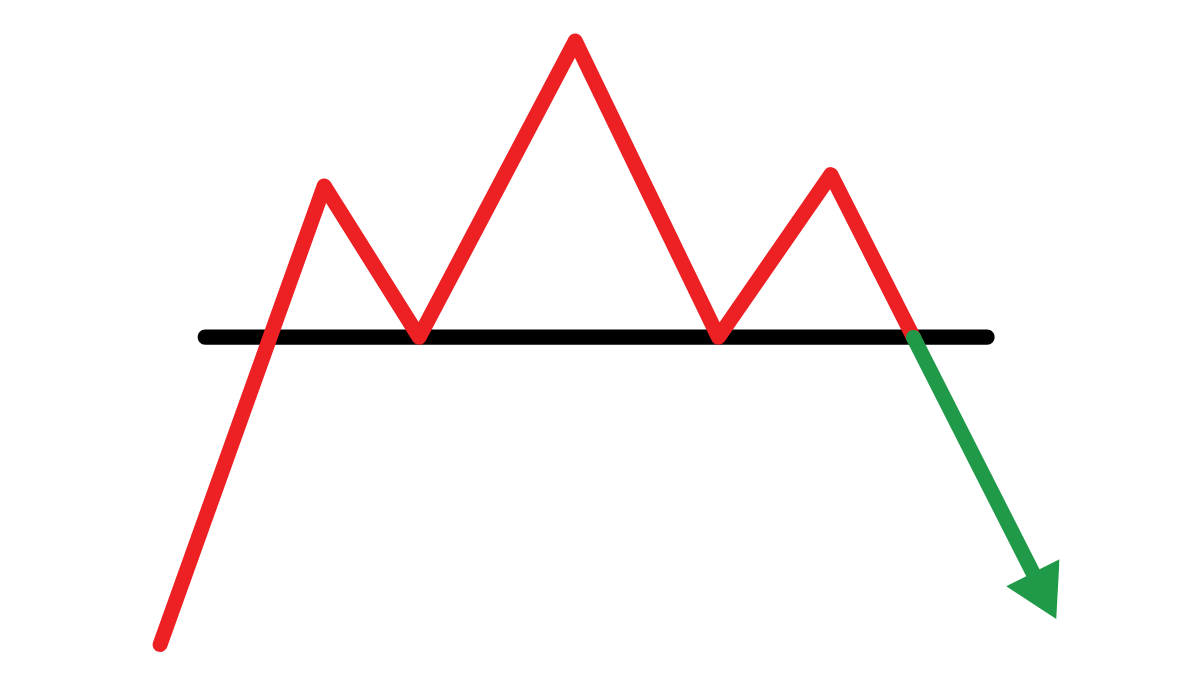
Head & Shoulders
Signals a trend reversal from bullish to bearish.
Psychology Behind It: Buyers are losing strength as each high becomes weaker, ending in a breakout below the neckline.
Entry Trigger: Breakdown below the neckline
Stop Loss Placement: Above the right shoulder
Profit Target: Distance from head to neckline projected downward
Works Best In: Uptrend
Reliability: High
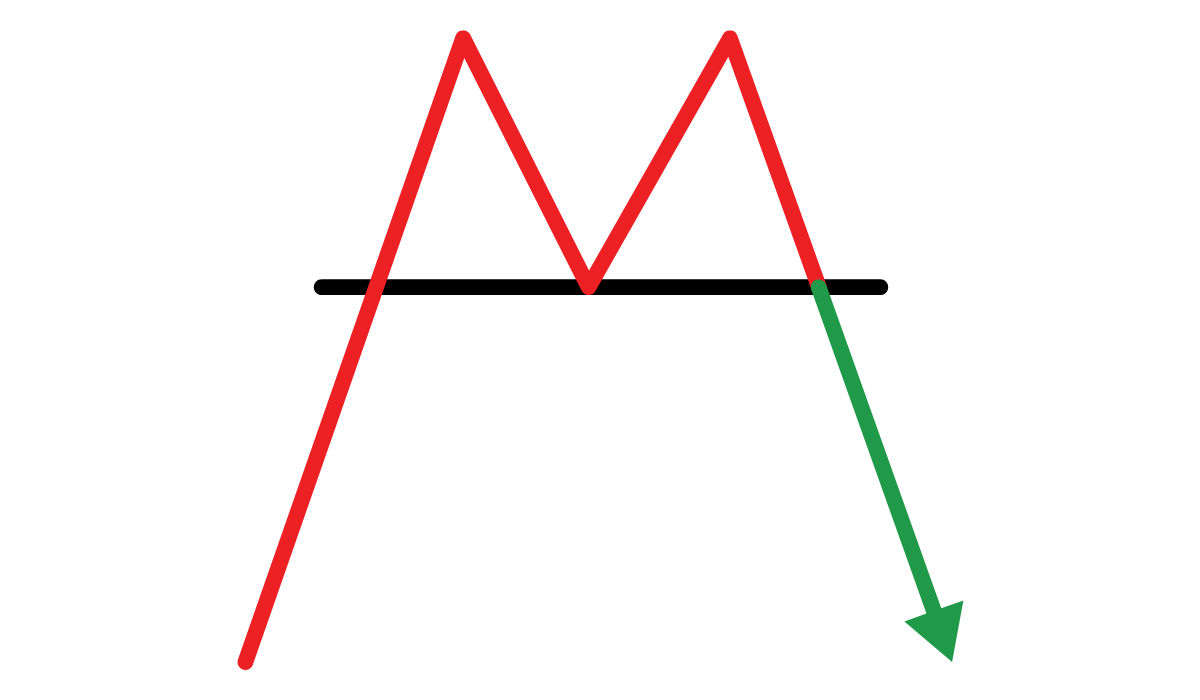
Double Top
A bearish reversal pattern after an uptrend.
Psychology Behind It: Price hits resistance twice and fails to break higher, suggesting a shift to bearish control.
Entry Trigger: Break below the neckline
Stop Loss Placement: Above the second top
Profit Target: Distance from tops to neckline projected downward
Works Best In: Uptrend
Reliability: High
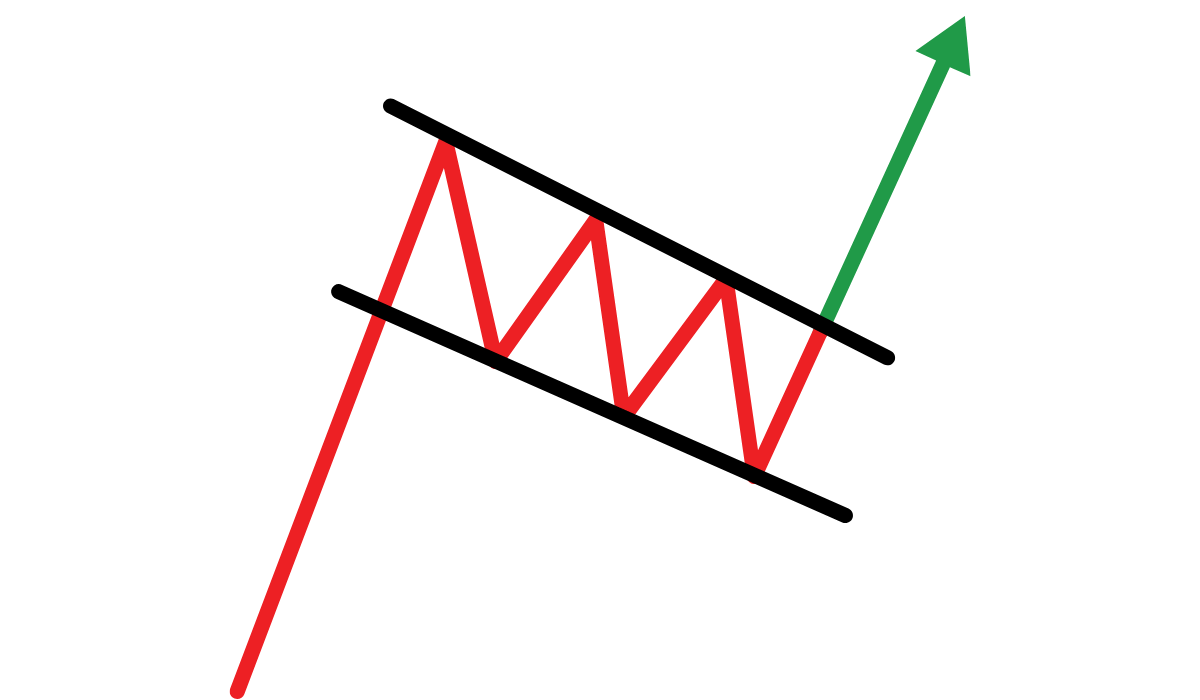
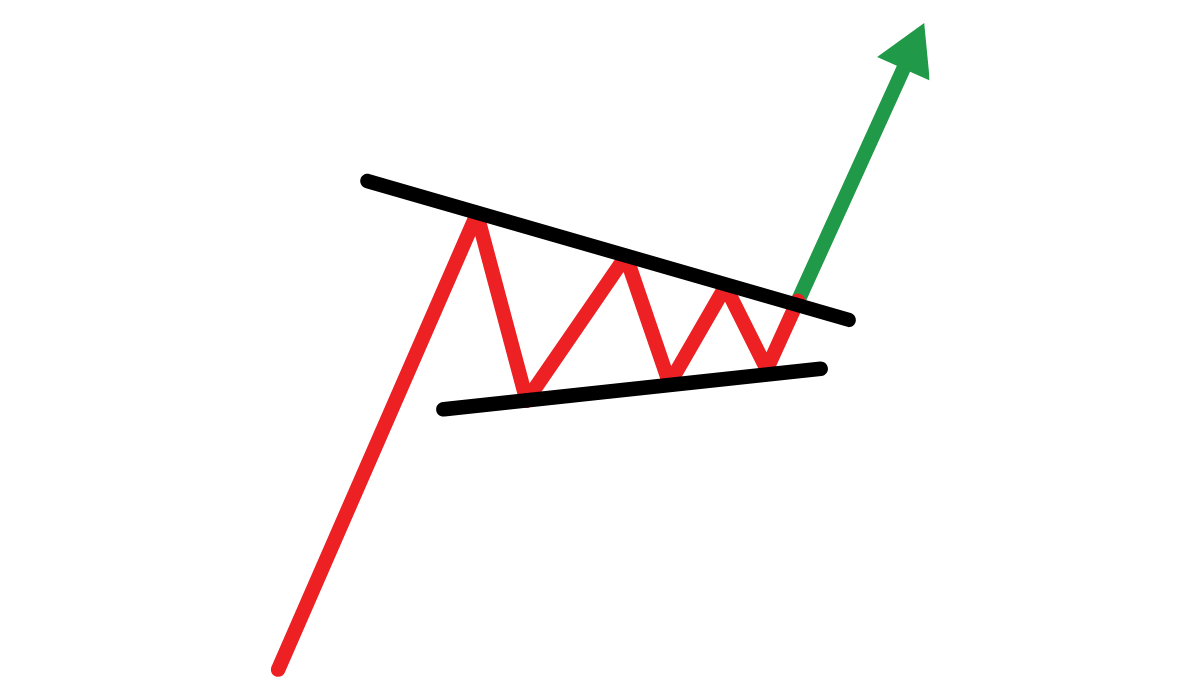
Bullish Falling Wedge
A bullish reversal pattern formed by two converging downward-sloping trendlines.
Psychology Behind It: Selling pressure weakens as price contracts; a breakout suggests buyers are regaining control.
Entry Trigger: Breakout above the upper trendline
Stop Loss Placement: Below the lowest point of the wedge
Profit Target: Height of the wedge projected upward from breakout
Works Best In: Downtrend
Reliability: Medium
Inverted Head & Shoulders
Bullish reversal pattern signaling a trend shift upward.
Psychology Behind It: Sellers lose momentum, forming a base, then buyers break out above the neckline.
Entry Trigger: Breakout above the neckline
Stop Loss Placement: Below the right shoulder
Profit Target: Distance from head to neckline projected upward
Works Best In: Downtrend
Reliability: High
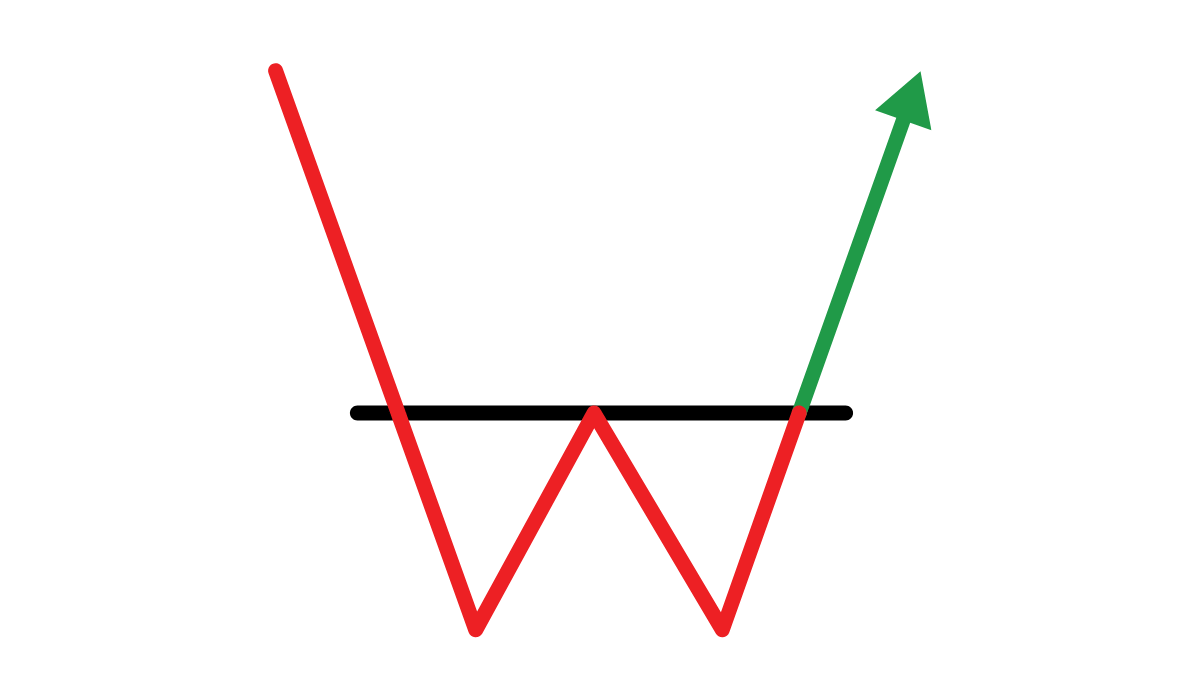
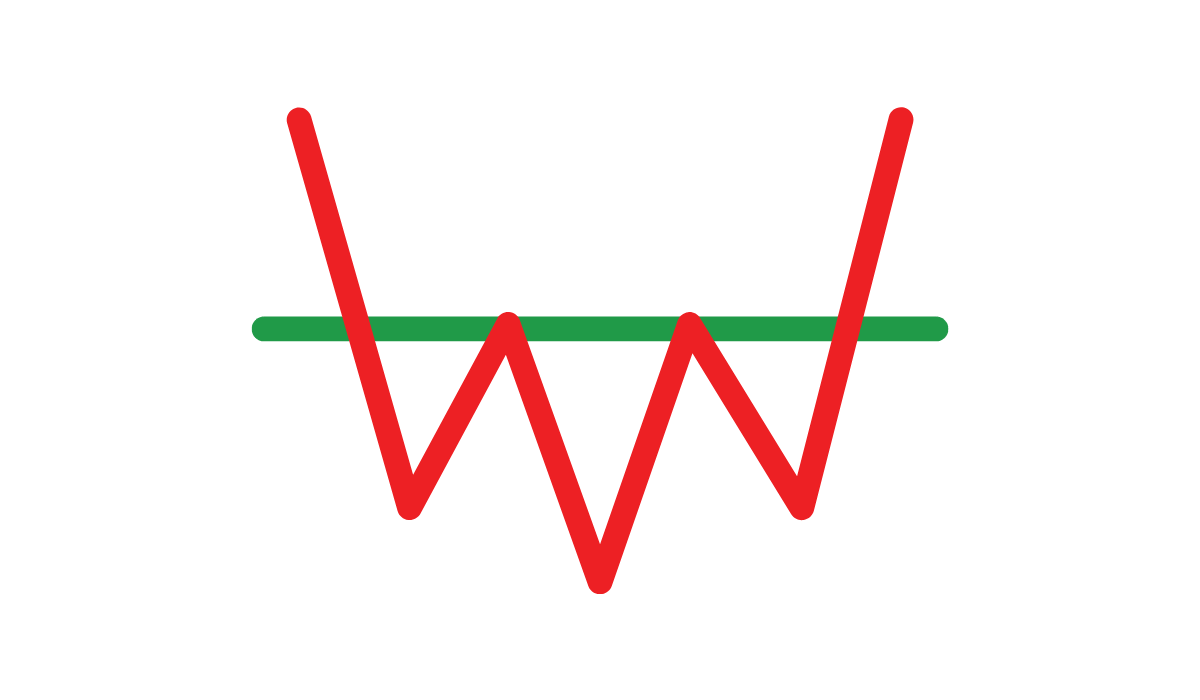
Double Bottom
Bullish reversal pattern after a downtrend.
Psychology Behind It: Price finds support twice and breaks higher, indicating buyer strength.
Entry Trigger: Break above the neckline
Stop Loss Placement: Below the second bottom
Profit Target: Height of pattern projected upward
Works Best In: Downtrend
Reliability: High
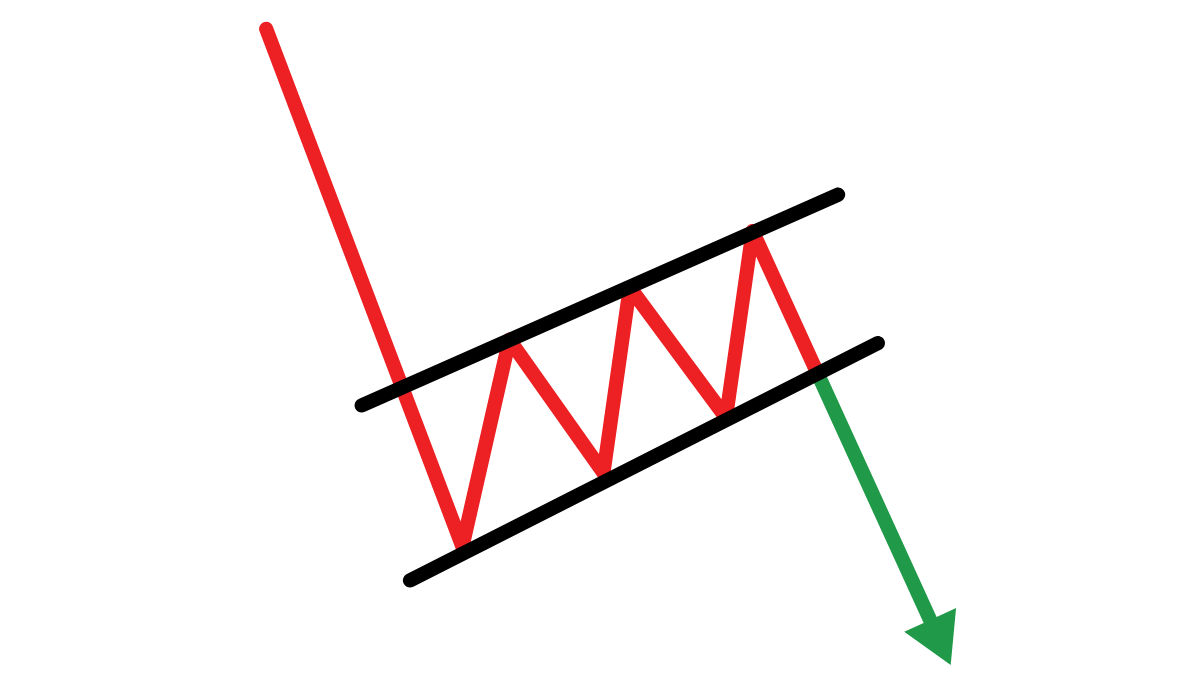
Bearish Rising Wedge
A bearish reversal pattern formed by two converging upward-sloping trendlines.
Psychology Behind It: Buyers push price higher, but momentum fades, and a breakdown signals seller strength.
Entry Trigger: Breakdown below the lower trendline
Stop Loss Placement: Above the highest point of the wedge
Profit Target: Height of the wedge projected downward from breakdown
Works Best In: Uptrend
Reliability: Medium
Continuation Patterns
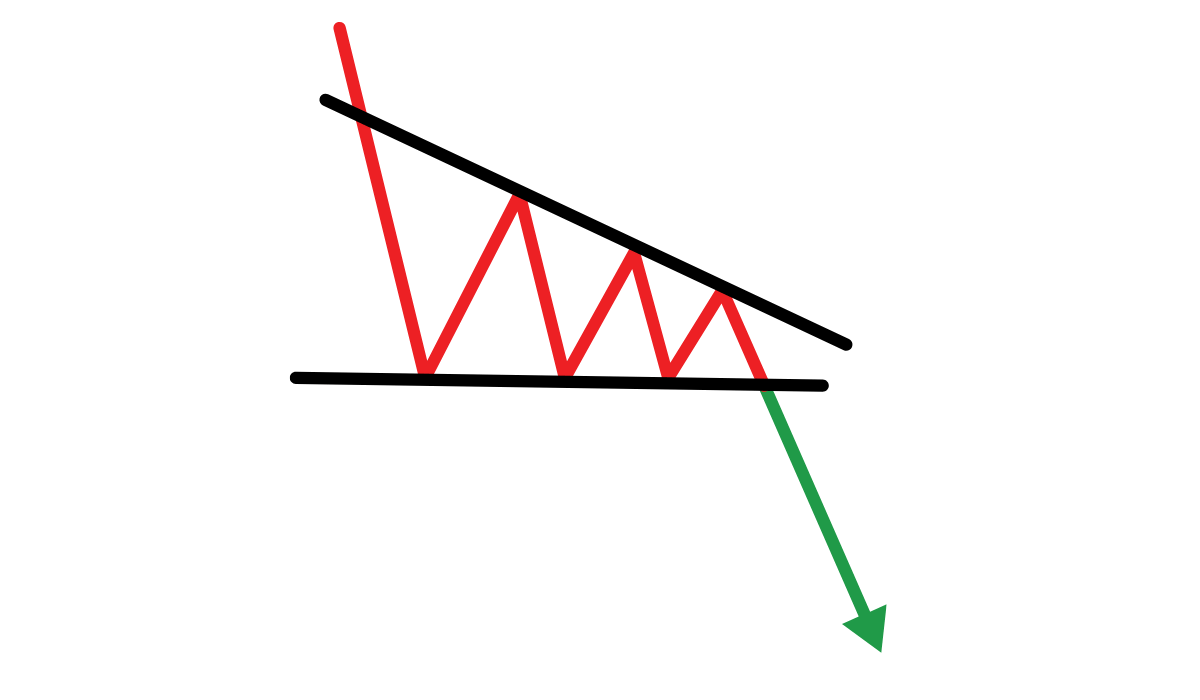
Descending Triangle
Bearish continuation pattern showing lower highs with flat support.
Psychology Behind It: Sellers are gaining control and pressuring support levels repeatedly.
Entry Trigger: Breakdown below the flat base
Stop Loss Placement: Above the most recent lower high
Profit Target: Height of triangle projected downward
Works Best In: Downtrend
Reliability: High
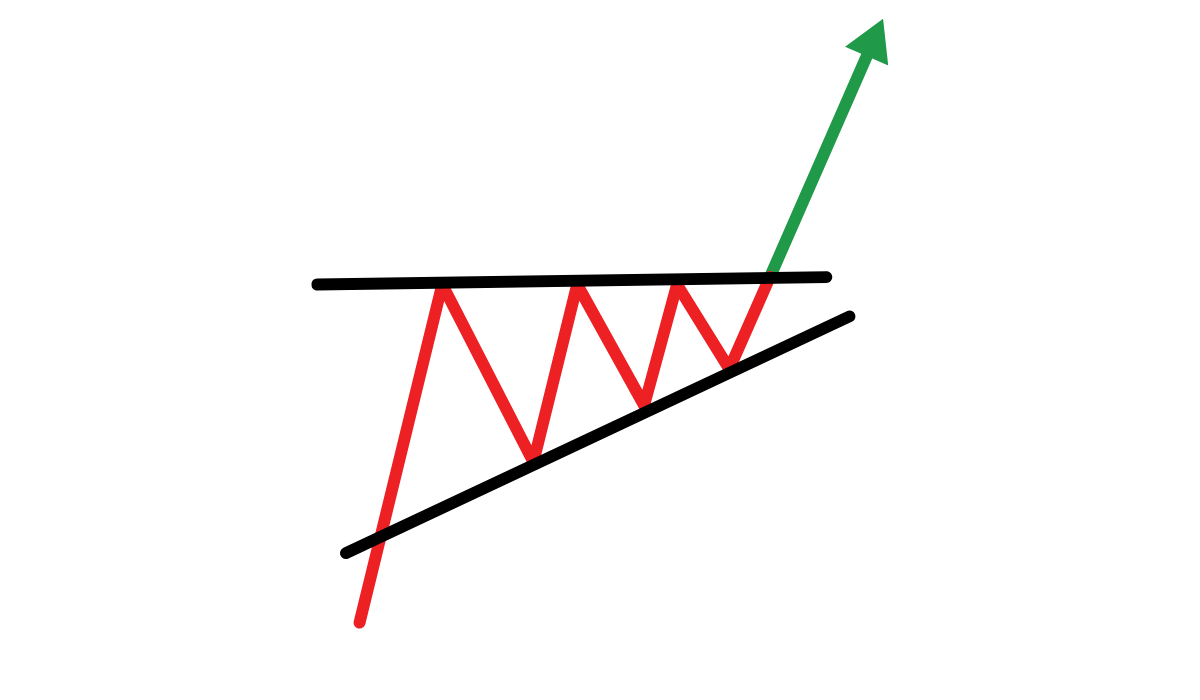
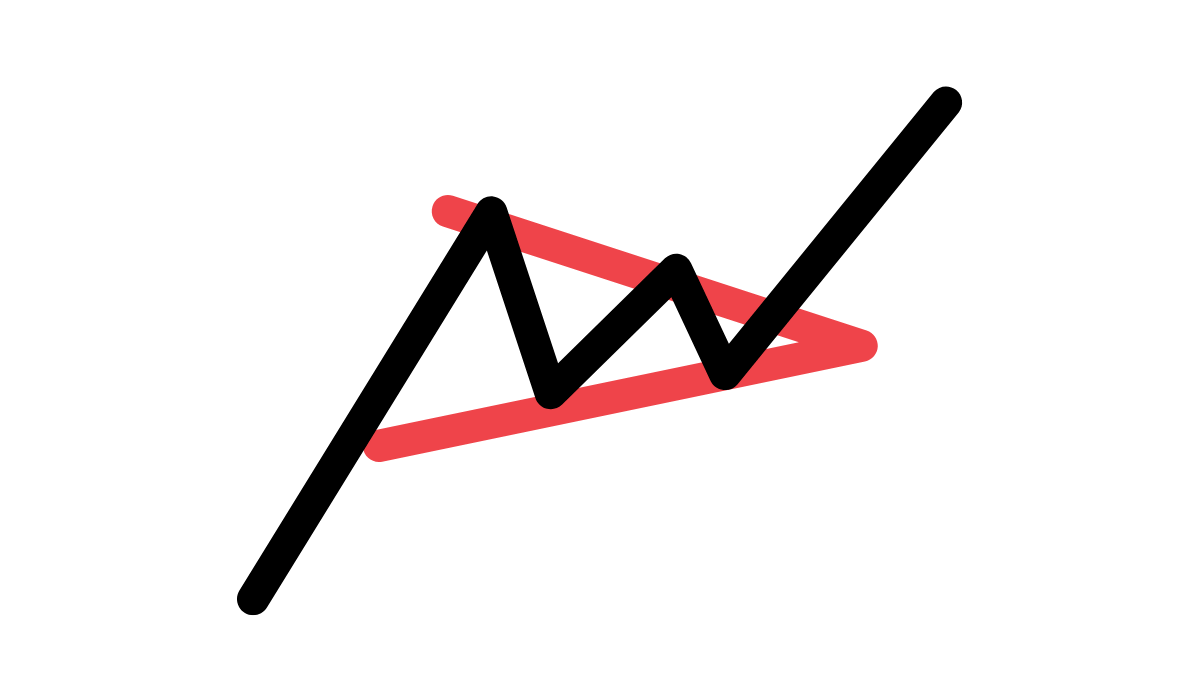
Ascending Triangle
Bullish continuation with flat resistance and rising support.
Psychology Behind It: Buyers are increasingly aggressive, squeezing the price toward a breakout.
Entry Trigger: Breakout above the horizontal resistance
Stop Loss Placement: Below the latest higher low
Profit Target: Height of triangle projected upward
Works Best In: Uptrend
Reliability: High
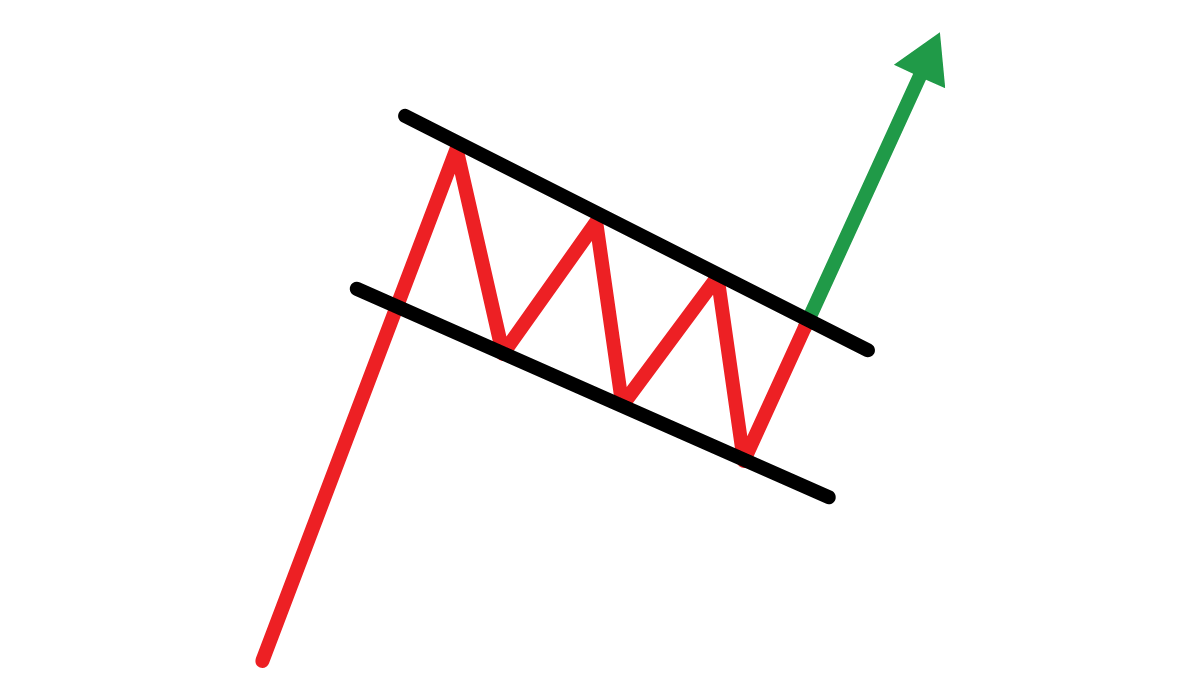
Flags
Short-term consolidation following a sharp price move.
Psychology Behind It: A pause in momentum that allows price to regroup before continuing in the same direction.
Entry Trigger: Breakout in direction of flagpole
Stop Loss Placement: Below opposite side of the flag
Profit Target: Flagpole height projected from breakout
Works Best In: Strong trends
Reliability: High
Pennants
Brief consolidation shaped like a small symmetrical triangle.
Psychology Behind It: Price contracts in a tight range before continuing the initial trend.
Entry Trigger: Breakout in direction of prior move
Stop Loss Placement: Below/above the pennant depending on direction
Profit Target: Pole height projected from breakout
Works Best In: Strong trends
Reliability: High
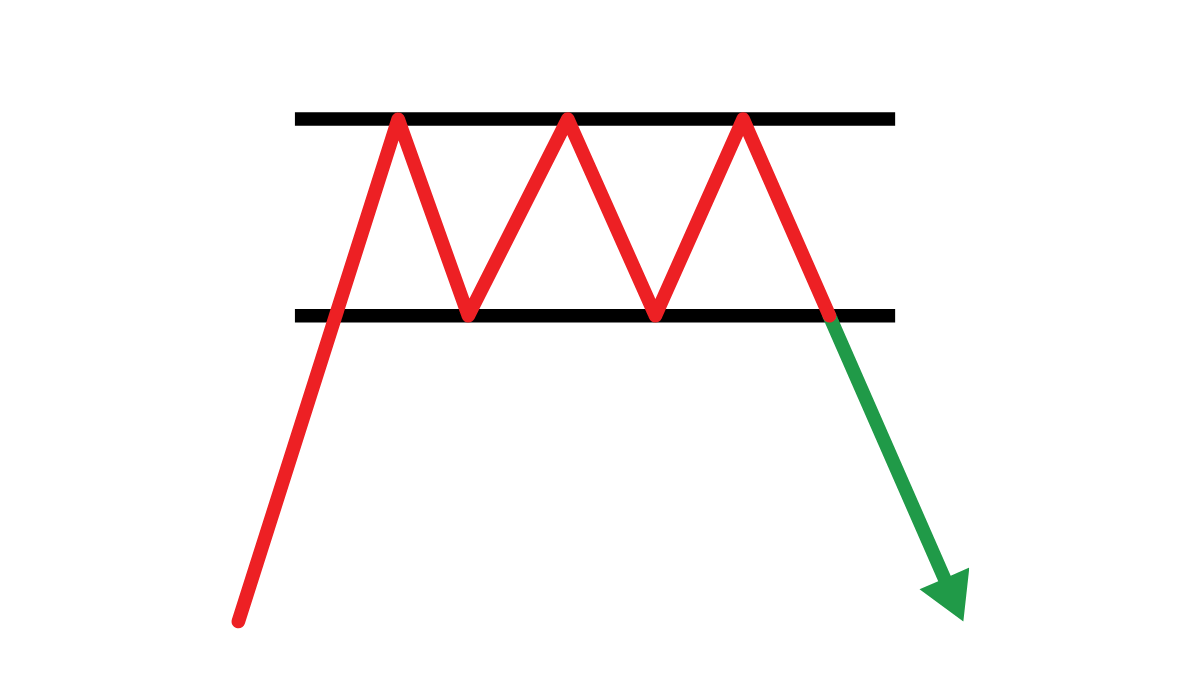
Rectangle
Price bounces between clear support and resistance.
Psychology Behind It: Indecision in the market before breakout resumes trend.
Entry Trigger: Breakout from the range
Stop Loss Placement: Opposite side of the range
Profit Target: Height of range projected from breakout
Works Best In: Trending markets
Reliability: Medium
Neutral Patterns
Symmetrical Triangle
Converging trendlines with no directional bias.
Psychology Behind It: Price compresses as buyers and sellers reach a standoff before a breakout.
Entry Trigger: Breakout in either direction
Stop Loss Placement: Outside the triangle
Profit Target: Height of triangle projected from breakout
Works Best In: Volatile or uncertain trends
Reliability: Medium