The Hottest Strategy in 2025
Introduction
In a market defined by rapid swings and volatile breakouts, our 15‑minute Opening Range Breakout (ORB) system stands out as a top performer in the first half of 2025. By combining early session volatility with trend‑confirming EMAs and ADX, this rule‑based approach captured the best momentum moves while keeping drawdowns in check.
Rules
- Timeframe: 15-minute chart
- Opening Range: High & low of the 9:00 AM NY / 2:00 PM London 15-min candle
- Indicators: 4‑h EMA 120, 15‑min EMA 120, EMA 20, SMA 25
- Trend Alignment: For longs, EMAs from fastest to slowest: SMA 25 > EMA 20 > EMA 120 > 4h EMA 120 (reverse for shorts)
- ADX(14) ≥ 25 to ensure strong trend momentum
- Entry:
• Long: Close above opening range high with bullish EMA stack and ADX ≥ 25
• Short: Close below opening range low with bearish EMA stack and ADX ≥ 25 - Exit:
• SMA 25 crossing EMA 20 in opposite direction
• OR fixed 3% stop loss
Performance Statistics
| Profit Factor | 1.81 |
| Net Profit | $60,173.92 |
| Net Profit % | 60.17% |
| Buy & Hold Return | –$40,383.27 |
| Buy & Hold Return % | –40.38% |
| Total Trades | 3,153 |
| Win Rate | 53.19% |
| Average Trade | $19.08 |
| Average Winning Trade | $80.19 |
| Average Losing Trade | –$51.10 |
| Max Drawdown | $7,957.29 |
| Profit/Drawdown | 7.56 |
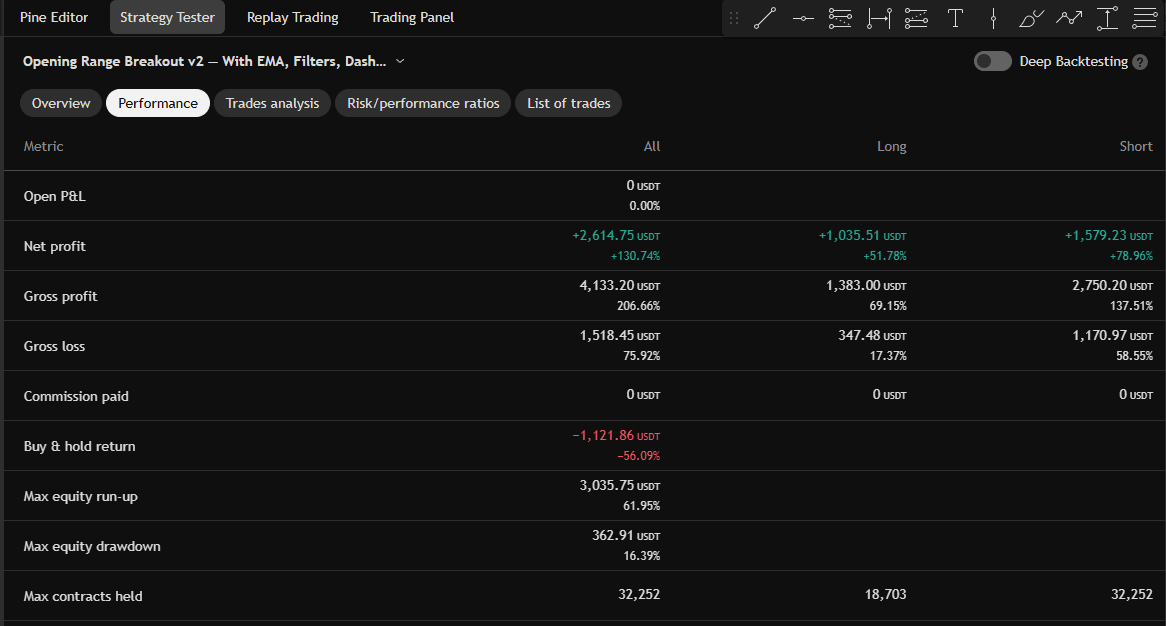
Performance Trading View Statistics
Examples on Trading View showing typical performance statistics.
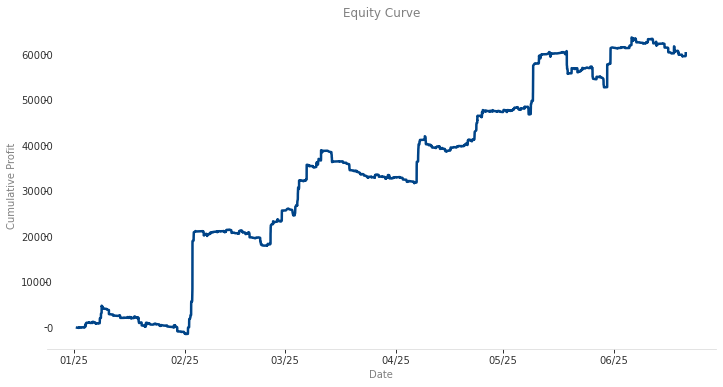
Equity Chart Combined
The cumulative returns highlight clear momentum captures with disciplined stops that cut drawdowns short.
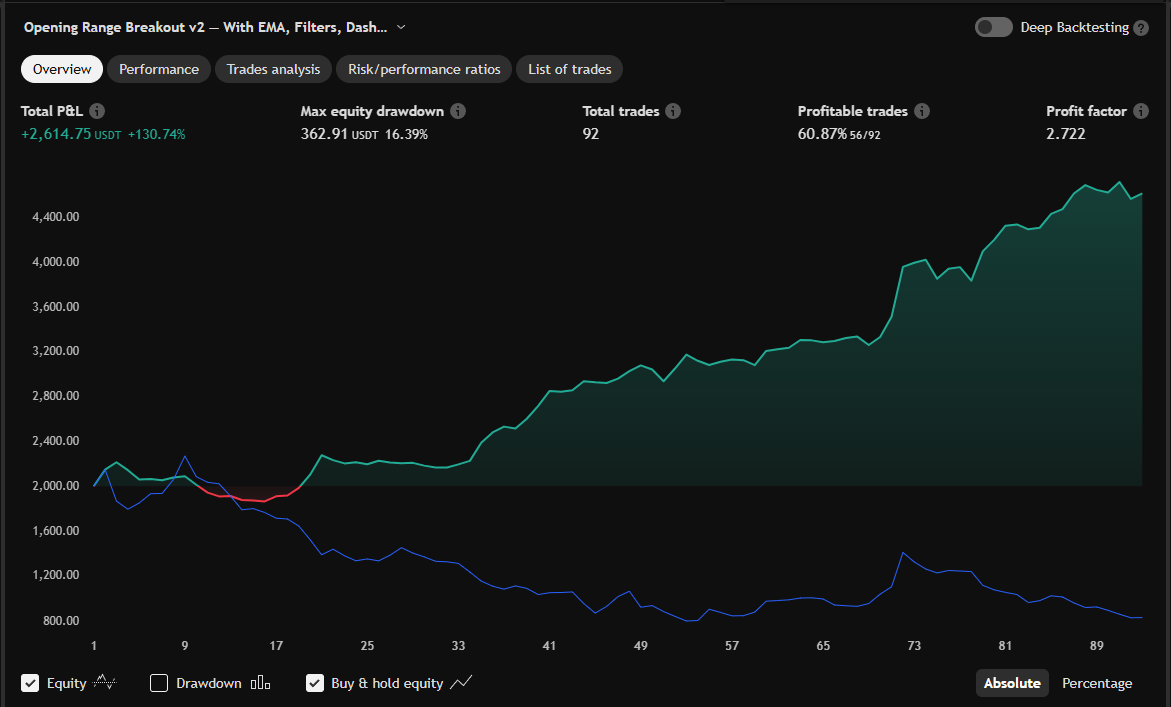
Equity Chart Trading View - Doge
Example on TradingView showing a typical equity curve.
Performance vs Buy & Hold
| Crypto | Net Profit | Buy & Hold Return | Win Rate | Worst Losing Run | Total Trades | Average Trade |
|---|---|---|---|---|---|---|
| ARB | $2940.02 | $-1208.44 | 71.88% | 2 | 64 | $45.94 |
| THETA | $2885.68 | $-1414.02 | 60.27% | 3 | 73 | $39.53 |
| BONK | $2739.37 | $-1118.62 | 59.26% | 4 | 81 | $33.82 |
| NEAR | $2650.21 | $-1161.47 | 65% | 5 | 60 | $44.17 |
| GRT | $2631.70 | $-1203.97 | 64.29% | 3 | 70 | $37.60 |
| DOGE | $2389.22 | $-978.88 | 60.26% | 6 | 78 | $30.63 |
| AVAX | $2191.36 | $-1030.08 | 63.33% | 4 | 60 | $36.52 |
| SHIB | $2146.94 | $-938.53 | 60% | 4 | 75 | $28.63 |
| INJ | $2121.92 | $-889.45 | 54.1% | 4 | 61 | $34.79 |
| POL | $2099.24 | $-1196.39 | 58.33% | 3 | 72 | $29.16 |
| ETH | $2079.41 | $-567.60 | 50.75% | 4 | 67 | $31.04 |
| FET | $2010.39 | $-982.81 | 50.82% | 6 | 61 | $32.96 |
| TIA | $1878.14 | $-1320.57 | 54.67% | 7 | 75 | $25.04 |
| OP | $1829.66 | $-1384.00 | 63.08% | 4 | 65 | $28.15 |
| IMX | $1803.99 | $-1417.66 | 56.58% | 4 | 76 | $23.74 |
| FIL | $1746.66 | $-1091.24 | 50.67% | 8 | 75 | $23.29 |
| DOT | $1735.28 | $-969.43 | 55.22% | 5 | 67 | $25.90 |
| VET | $1625.31 | $-1042.10 | 50.72% | 5 | 69 | $23.56 |
| RENDER | $1539.82 | $-1105.97 | 57.89% | 3 | 76 | $20.26 |
| ATOM | $1461.36 | $-740.04 | 54.84% | 4 | 62 | $23.57 |
Monthly Performance (H1 2025)
Solid gains in February–May offset the small dips in January and June, culminating in a 60% total return.
| Month | Net Profit |
|---|---|
| January | –$1,387.15 |
| February | $27,030.05 |
| March | $7,306.36 |
| April | $14,317.59 |
| May | $14,098.26 |
| June | –$1,191.19 |
| Total H1 2025 | $60,173.92 |
Get Started on TradingView
Try the Opening Range Breakout system free on TradingView. Apply it to any crypto or equity chart and see the breakouts for yourself.
For more advanced strategies and in-depth tutorials, visit our trading course at profitwithtrading.com.