Introduction
The RSI Trend Rider is a day trading strategy designed primarily for the crypto markets, though it also works on stocks and forex. It emphasizes simplicity and trend-following principles.
Strategy Overview
Core Idea
The approach is to trade with the trend, using RSI to spot temporary price pullbacks and then ride the trend continuation. This is a long only strategy that protects your capital and keeps you out of the market in bear markets.
Tools & Indicators
- •20, 50 and 200-period EMA: To determine the trend direction
- •4-period RSI: To time pullbacks and reversals
- •ADX 14 for trend confirmation
- •200 day EMA as a filter
Strategy Rules
Entry Conditions
- •Price is above the 200 period EMA
- •20 EMA is above 50 EMA
- •50 EMA is above 200 EMA
- •ADX is above 25
- •Price is above 200 day EMA
- •RSI (4-period) crosses below 25
Exit Conditions
- •Take Profit: Exit when price rises 20% from entry
- •Stop Loss: Exit if price drops 10% from entry
- •Trend Exit: Exit if price closes below the 200 period EMA, regardless of profit or loss
Filters
- •Highly liquid assets for crypto: Market cap above $200 million and listed on top 10 centralized exchanges
- •Highly volatile assets
- •Market leaders - choose the best performing assets
Trade Example: RSI Trend Rider DOT/USDT
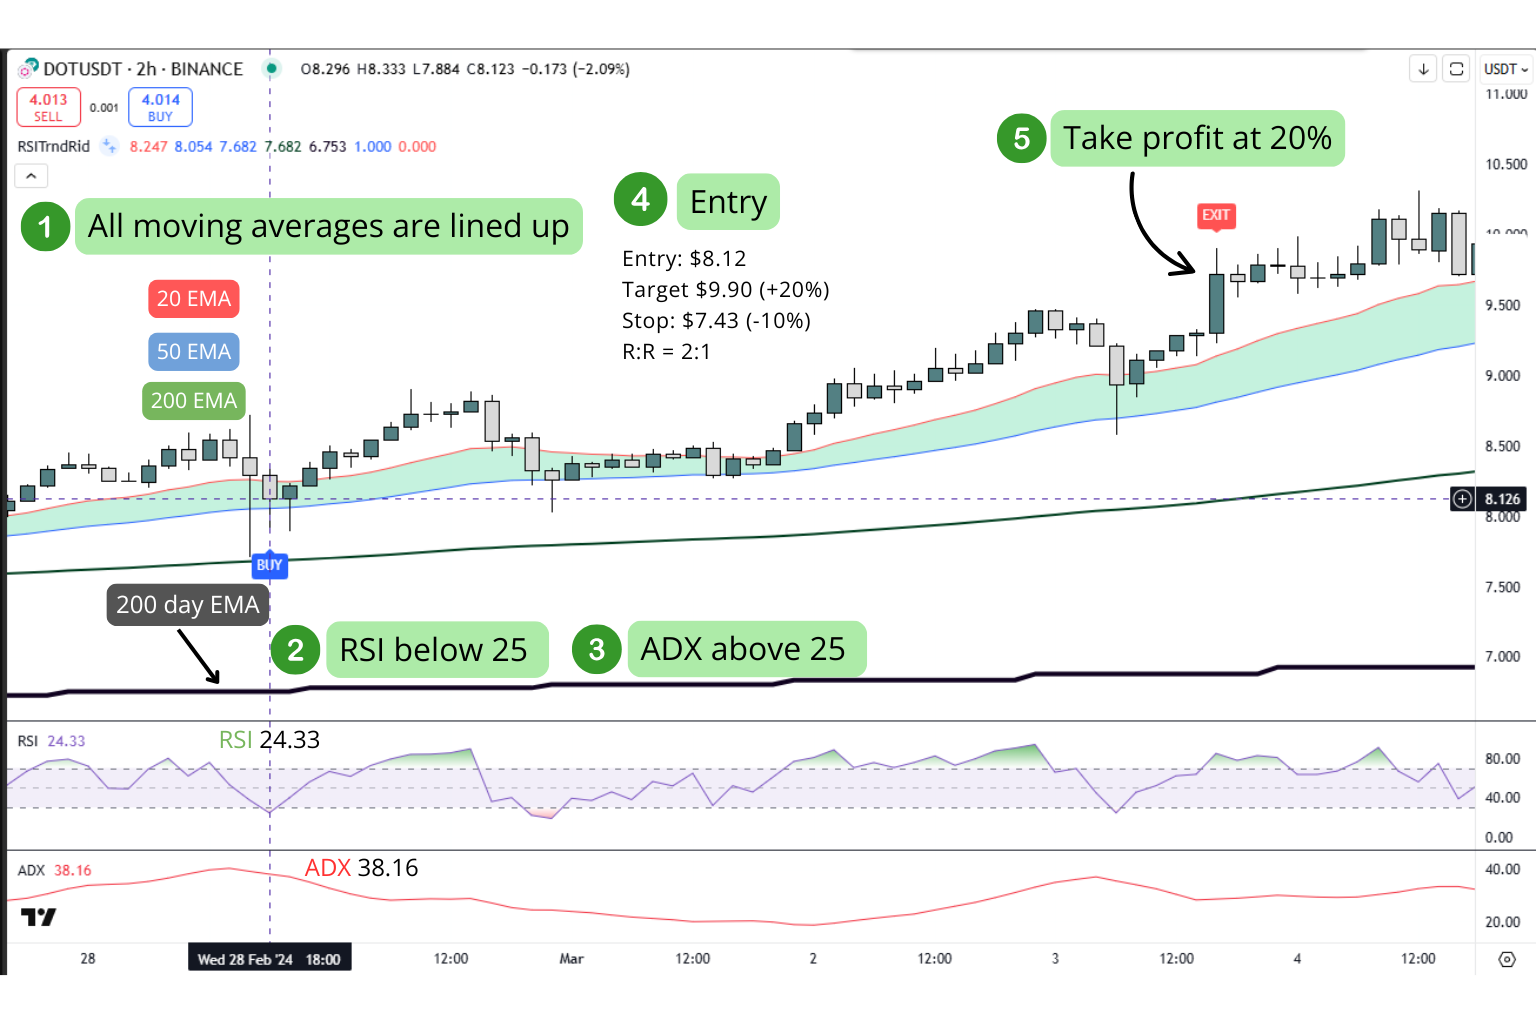
Entry based on RSI crossing below 25, ADX above 25 and all moving averages lined up. Target hit within 36 hours.
Performance Metrics
| Description | Value |
|---|---|
| Net Profit | $1792787.82 |
| Net Profit % | 1792.79% |
| Buy & Hold Return | $-28163.41 |
| Buy & Hold Return % | -28.16% |
| Profit Factor | $34.46 |
| Total Trades | 19 |
| Number Winning Trades | 16 |
| Number Losing Trades | 3 |
| Win Rate % | 84.21% |
| Average Trade | $94357.25 |
| Average Winning Trade | $115398.46 |
| Average Losing Trade | $-17862.53 |
| Risk Reward | $6.46 |
| Average Bars in Trade | 83 |
| Max Winning Trade | $328026.29 |
| Max Losing Trade | $-38555.50 |
| Max Drawdown | $38555.50 |
| Worst Losing Run | 1 |
| Profit/Drawdown | $46.50 |
All figures in USD unless otherwise stated.
Equity Curve
Performance Over Time
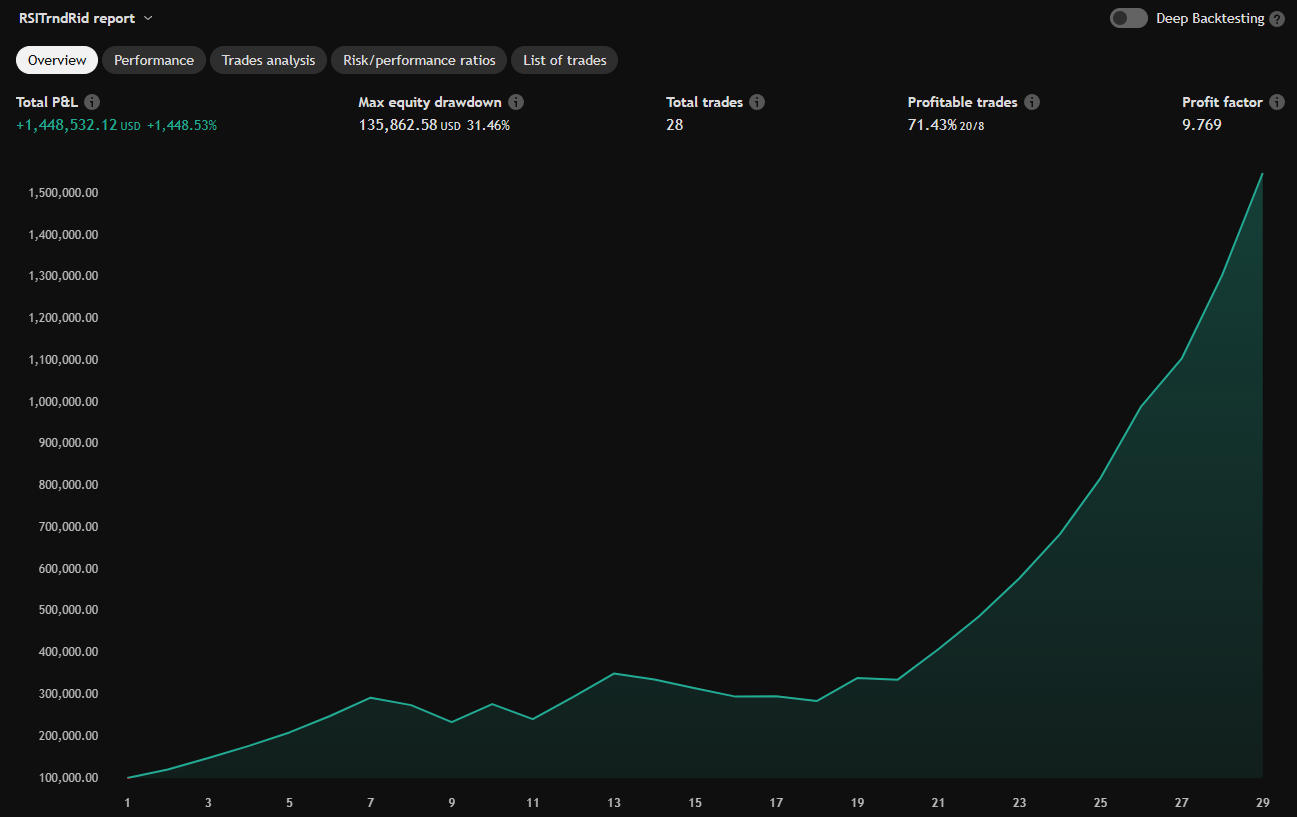
Equity curve for rsitrendrider
Annual Performance
| Year | January | February | March | April | May | June | July | August | September | October | November | December | Total |
|---|---|---|---|---|---|---|---|---|---|---|---|---|---|
| 2024 | $52,895.19 | $22,005.03 | $136,932.92 | $56,265.83 | $29,849.19 | $92,416.24 | $-39,751.53 | $-5,444.49 | - | - | - | - | $345,168.38 |
| 2023 | - | - | - | - | - | - | - | - | - | - | $3,427.59 | $322,950.45 | $326,378.04 |
| 2021 | $31,348.88 | $121,279.54 | $-12,647.94 | - | - | - | - | $56,811.62 | $-38,555.50 | $85,186.44 | $80,319.97 | - | $323,743.01 |
Conclusion
The RSI Trend Rider is a simple strategy that combines trend filtering with RSI pullback entries. It is Robust across different markets, backed by real-world performance and designed for traders who want rule-based entries and exits with minimal complexity.